Mean Absolute Error (MAE)
MAE is calculated by:
Mean Squared Error (MSE)
MSE is calculated by:
Root Mean Squared Error (RMSE)
RMSE is calculated by:
0 or near 0.
Mean Absolute Percentage Error (MAPE)
MAPE is calculated by:
Symmetric Mean Absolute Percentage Error (SMAPE)
SMAPE is calculated by:
0 or near 0.
Heatmap of Predicted vs. Actual Values
Kumo provides a heatmap of predicted values versus the actual target labels for all entities in the predictive query, in your training table’s holdout and evaluation set. This can be used to spot-check the quality of your trained predictive query. The predictions are generated by applying the trained predictive query to every single row in the training table that was generated during predictive query training. The actuals are the target labels from the training table.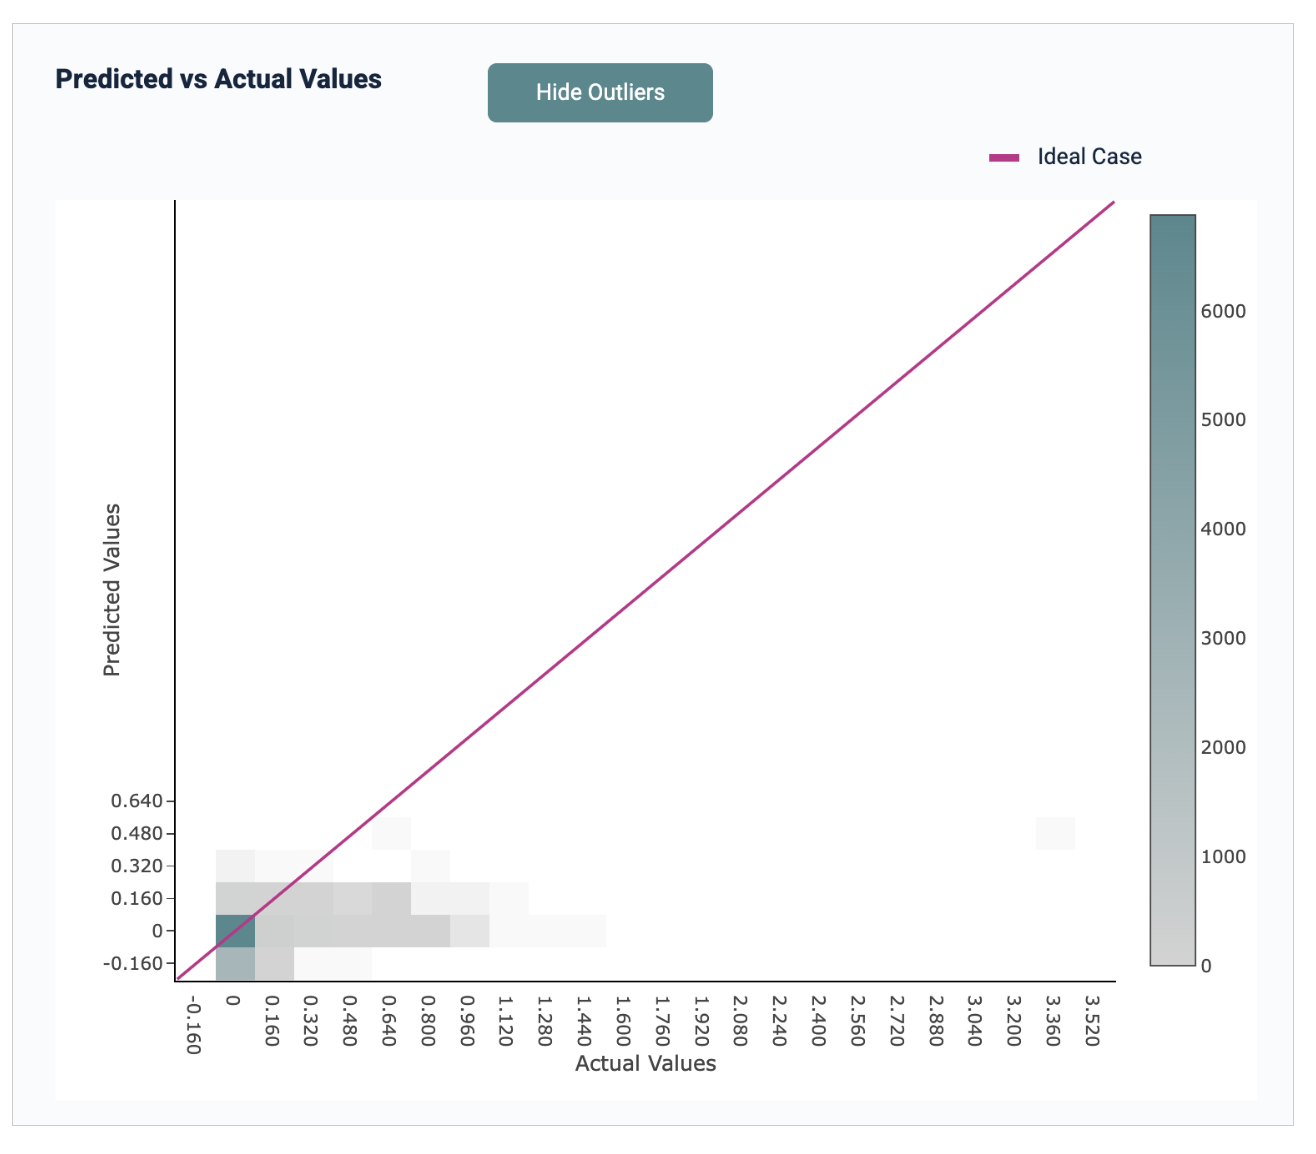
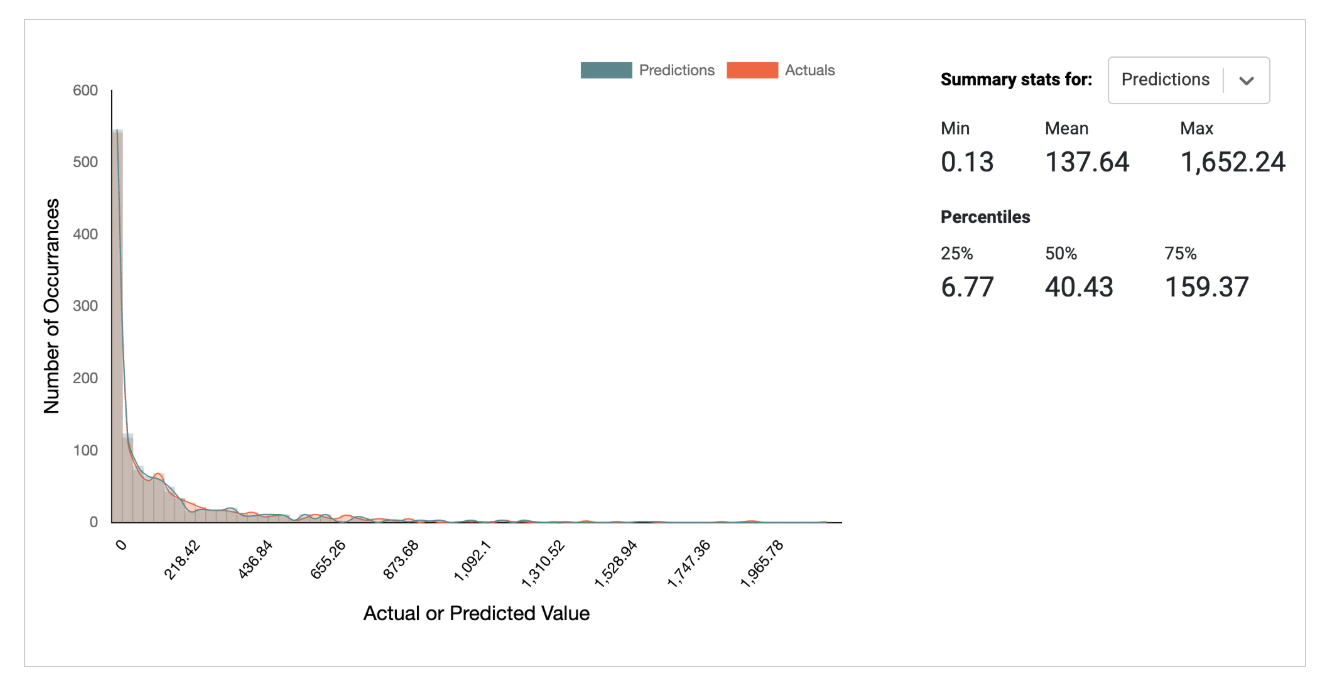
Distribution of Predictions Histogram
Kumo also provides a histogram of the predicted values alongside the actual target labels for all entities in the predictive query, in the holdout and evaluation set of the training table. This can be used to spot-check the quality of your trained predictive query. The predictions are generated by applying the trained predictive query to every single row in the training table that was generated during predictive query training. The actuals are the target labels from the training table.