

Impact:
- 4 days loading data to modeling to business results
- 73% Precision@12 for new item recommendation
Problem
A leading US online personal finance & banking company wanted to improve revenue by doing targeted outreach to client’s users who might be interested in taking revenue-generating actions on their site – such as opening new accounts. For example, they would send emails to appeal to such users, or show some guiding pop-ups to lower the friction for such users to take the targeted actions.
However, there existed a few challenges. First, revenue is produced by various products or pages, so the client needed predictions about many kinds of events – such as buying products of type A, opening accounts of type B, etc. Second, there were a lot of user behavior tracking logs, but all the logs were all in raw form without feature engineering. If the client had to build a separate model with newly engineered features for every kind of interesting event, then we would be in trouble.
To support this use case, the client chose about 10 important event types and formulated a multi-label classification problem that predicts which of the 10 individual event types would happen in the next 90 days, all with one model.
Data Setup
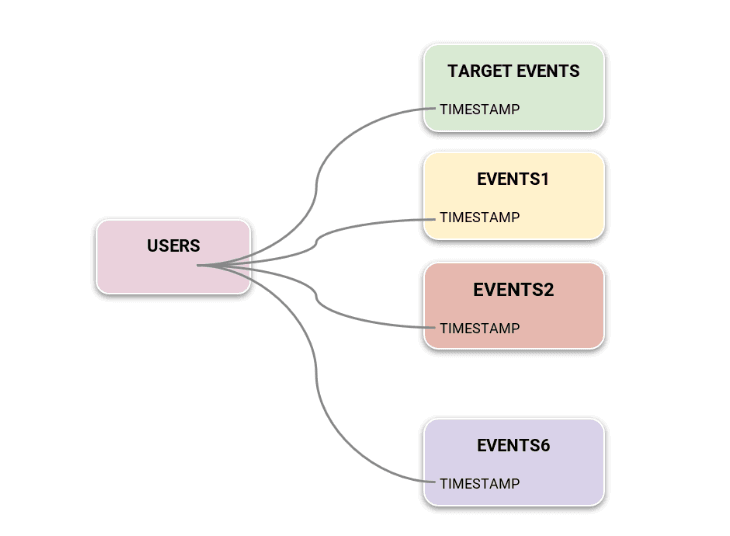
For the input data, the client decided to use almost all of raw event logs as is, which included tens of different kinds of tracking events distributed across 6 different tables with different metadata schemas. Since the customer cared only about making predictions for a small subset of these tens of events, we also created a separate dedicated ‘TargetEvents’ table recording only the occurrences of those specific events, specifically for use in prediction target label formulation. They also created a Users metadata table for capturing user attributes that are consistent over time. Figure 1 shows the schema of input data used for this use case.
They used 1 year of data to start with for simplicity, understanding that the model performance can be always improved by adding more past data anytime.
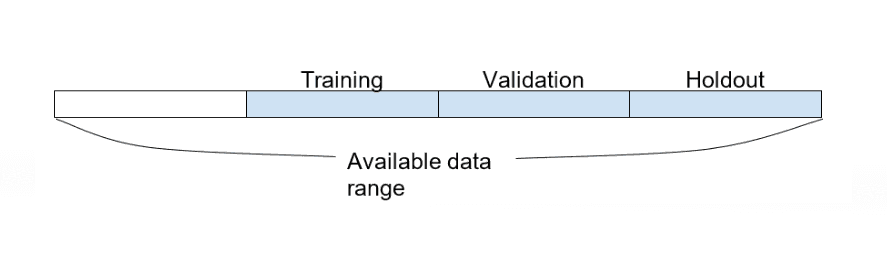
With this 1 year of data, since the client needed a prediction horizon of 90 days, they decided to use the last 90 days for holdout, the second last 90 days for validation, and the other 90 days for training. The first 90 days of data was excluded from training as there was no input data available to predict for that period. Overall, they used more than 3B events for millions of users.
Kumo Setup
With this data and problem setup, configuring it on Kumo is very easy. Client used Snowflake and prepared the Users table, TargetEvents table, and 6 different Events tables (Events1 ~ Events6) where each table has a UserID column in common. All they needed to do here was connect to their Snowflake account with Kumo’s built-in connector, and import the prepared tables into Kumo. They then created a star-like graph according to the data schema in Figure 1.
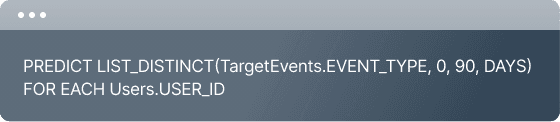
Next they created a Predictive Query to specify our ML problem:
Advanced Options
train_start_offset: 270
Here, EVENT_TYPE represents the types of events we are interested in (e.g. opening accounts) and PREDICT LIST_DISTINCT(TargetEvents.EVENT_TYPE, 0, 90, DAYS) literally predicts the existence of each event type in the next 90 days for each user, represented by Users.USER_ID. train_start_offset: 270 ensures we avoid using the first 90 days for training.
And that’s it! The client didn’t need to create different models for predicting different event types, engineer any features, create any feature pipelines, insert features into a feature store, etc.
Iterations
PRELIMINARY RESULTS ON SAMPLED DATA
Before jumping into training on the full dataset, quickly obtaining preliminary results with a sampled dataset is very typical. For this step, the client could create SQL-based Views on top of existing tables in the Kumo platform, so leveraged this for sampling datasets. For example, they sampled just 10% of the original users by creating a view with the following query:

They can then create the same kind of graph as in Figure 1, using these sampled views instead of the original tables. Then we can run the same Predictive Query using this graph. By default, Kumo will run AutoML to choose the best hyperparameters, which leads to a longer training time. Since the purpose of preliminary results is to get quick directional results and not to max out model
quality, we set the num_experiments: 1 in the Advanced Options to avoid unnecessary AutoML experiments.
Once we finish training, all the related evaluation metrics are produced. Here we focus on the macro Average Precision (macro-AP), which is the mean of per-class Average Precision. From the model on this sampled graph, we obtained 11 times better macro-AP (0.048) than the heuristic frequency-based baseline, which regards the historic frequency of a certain event for each user as the likelihood score.
Hypothesis testing
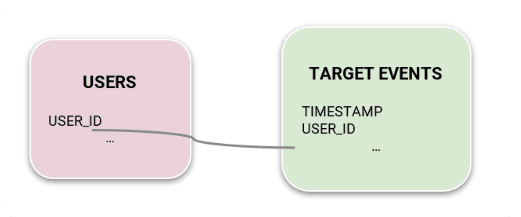
They obtained a decent first model performance, but wondered whether adding the 6 very large raw event tables was helpful for modeling or just added random noise. They could use Kumo to easily test this hypothesis by just simplifying the graph. Instead of using the full graph in Figure 1, they created a simple graph only including Users and TargetEvents, and ran the same Predictive Query.
From this experiment, they obtained 0.008 macro-AP, which is 5 times worse than what they obtained from the first model. They thus verified that raw event tables brought significant signal for the given prediction task!
Full training with AutoML
Now that they achieved fair preliminary results and verified that the raw tables are valuable, they needed to optimize hyperparameters using the full graph. This step is straightforward. They just selected the full graph we created in Figure 1 for a new Predictive Query and removed the previous Advanced option capping num_experiments to 1. Then by default, AutoML was kicked off with 8 experiments.
From this AutoML training on the full dataset, they achieved 0.066 macro-AP, which is 38% better than the first model on the sampled graph! This was a very promising result, and they wanted to understand the source of improvement.
As explained above, it is very easy to verify this hypothesis: run another Predictive Query on the 10% sampled data graph with turning on AutoML. This query produced only 0.051 macro-AP, which is only 6% improvement over the first experiment. Thus, they could conclude that the remaining 29% of improvement comes from scaling the dataset to the full graph. This conclusion is well-aligned with ML intuition that feeding more data is usually the best way to boost model performance.
Refit
In the approaches so far, they trained a model only using the training period (one 90-day period) and used the validation period for AutoML model selection. However, theoretically, once AutoML finds the best hyperparameters, the model can be retrained additionally using the data in the validation period. It is called ReFit.
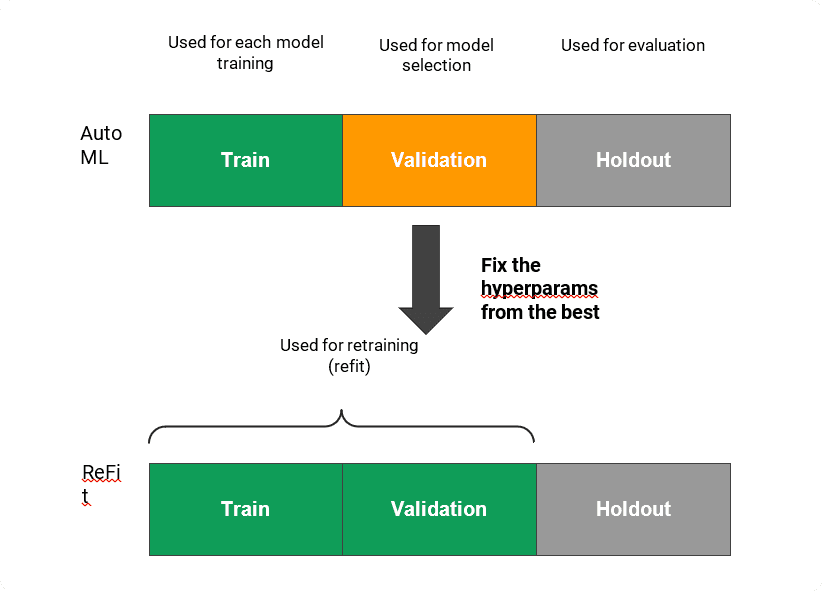
The client could control this Refit from the Advanced Options. In their use case, to evaluate on the same holdout period, they ran the query with the following Advanced option:

From this query, they achieved 0.083 macro-AP, which gave an extra 27% improvement over the query without ReFit. Note that using ReFit doubled the volume of target labels and also trained the model on more recent data, so this improvement also aligns well with ML intuition.
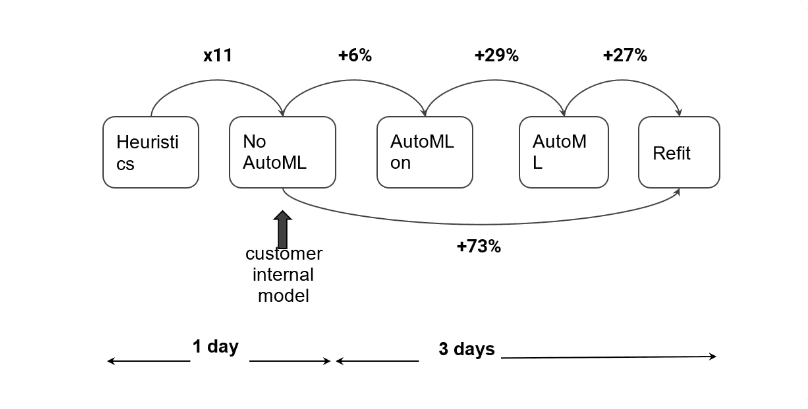
From the moment of connecting data, it took only 1 day to get preliminary results, which were already 11 times better than the heuristic baselines and comparable with the client’s internal model, and also ran some hypothesis testing on the same day.
After having the preliminary results, they performed the additional iterations mentioned earlier such as training on the full data and switching on ReFit, thus achieving 73% additional gain in terms of macro-AP. And all the gain here took only 3 days!
Conclusion
This case study shows the value of the Kumo platform, which is designed to enable data scientists to do much faster iteration and hypothesis testing, thus dramatically improving their final model quality, all with just a few clicks and lines of code.
Join our community on Discord.
Connect with developers and data professionals, share ideas, get support, and stay informed about product updates, events, and best practices.