
Impact:
- Production-deployable model performance in 4 days after data sharing
- 40% improvement in Recall@100 over complex and hard-to maintain internal ML model
Problem
Recommendation systems are one of the most powerful tools that consumer marketplaces have available to them. Even just a single percentage increase in conversion rate from relevant and high-quality recommendations can lead to millions in new revenue. Rightly so, many businesses spend a considerable amount of engineering resources to squeeze out as much signal from their data as possible.
We recently worked with an on-demand delivery service that did just that. Their engineering team spent a couple of years reading research papers and trying to implement the most sophisticated recommendation system they could find at scale. Fast forward to a couple of months after this model was deployed in production and it’s only been retrained once! This means stale data and lost signal.
We hear the same pain points over and over again. The machine learning team at these kinds of businesses have two choices. They can either go with the tried and true simple approach, which is easy to productionize but leaves some business value on the table because you’re not making the most out of your data, or they can go with the cutting edge model of the day which may be more accurate but is expensive to run, hard to maintain, and not very scalable. Thankfully, Kumo’s recommendation systems have been battle-tested at scale in production to get the best of both worlds
From raw enterprise data to a Kumo Graph
The first step was adding data, which was as simple as writing some tables in parquet format to an S3 bucket and creating a Connector with that path.
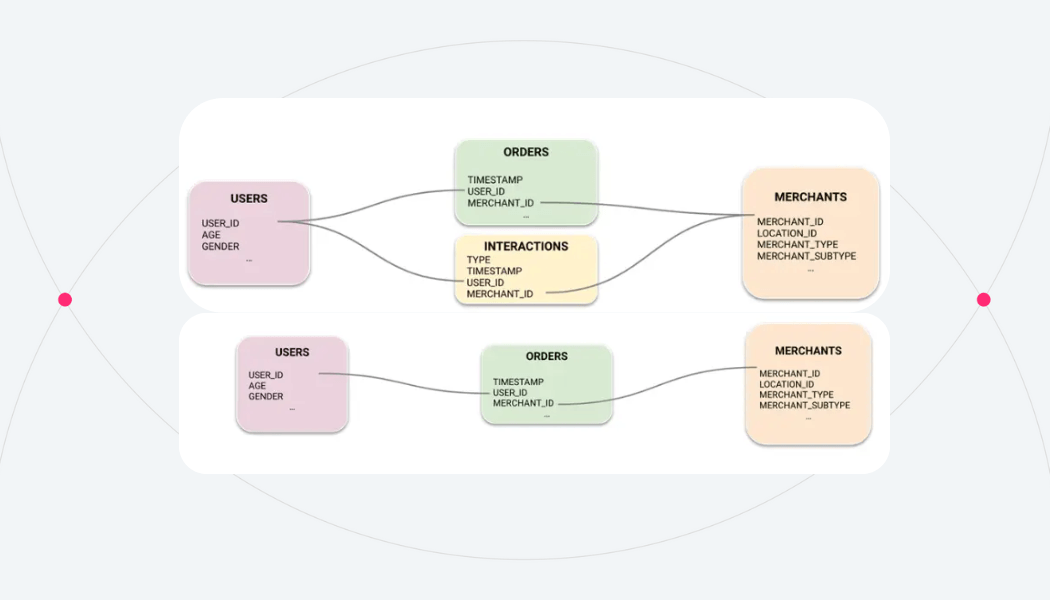
The client had four tables available for this problem: Users, Merchants, Orders, and Interactions. Users and Merchants were Dimension tables that contained static information about each entity type. In this case, a user represented one of the business’s consumers, and a merchant represented a variety of businesses such as restaurants, grocery stores, pharmacies, and more. The Orders and Interactions tables contained information that gave us signal about what merchants each user placed an order from, as well as other interactions such as searches, clicks, abandoned carts, etc. In total the data contained around 3 billion rows.
Once they had the data available in the platform and inspected column and table statistics to make sure the data distributions looked as expected, the client was able to connect the tables together to create the Graph. Connecting tables to make a graph is as easy as selecting the primary key from one table and what foreign key in another table it links to.
Modeling the business problem with our Predictive Query Language
The business use case for this recommendation model they wanted to build was to recommend what merchants each user is most likely to place an order from in the next 7 days. Translating the business problem to our proprietary Predictive Query Language we get the following query
It’s as simple as that! Within an hour of the data being available in S3 with the correct permissions, they were able to create the connector, ingest tables, create a graph, write the Predictive Query, and start training.
Testing modeling hypotheses with Kumo
One of the key benefits of using Kumo is how easy it is to test hypotheses, run ablation tests, and compare the results from each model to choose the winner. Kumo allows data scientists and machine learning engineers to build better models by rapidly iterating on their modeling plan for each training job.
The metric that this client cared most about was Recall@100. This metric will tell us what percentage of the merchants that the user actually placed orders from were recommended in the top 100 predictions by the Kumo model.
Running a base query
The client ran the first query with the default values in the “Fast Mode” Model Plan. This mode runs a fewer number of trials but allows you to iterate much faster. The base query only took about an hour to complete! This model gave them a good starting point for the evaluation of 66% recall – a 29.4% improvement over the business’s existing legacy model, which uses a set of user and merchant embeddings calculated using a Graph Neural Network followed by a costly hierarchical clustering approach.
With a great Kumo model already in hand, they were curious to find out — where’s the signal coming from?
Do we need interactions?
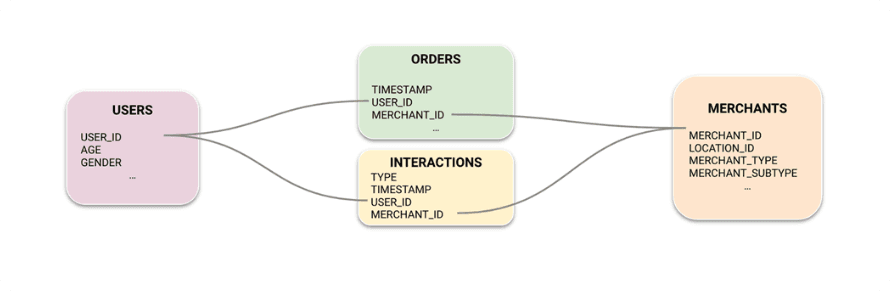
The next hypothesis they wanted to test was whether the interactions table was adding signal or just noise to the problem. It was easy to test this by creating a new graph only containing the other three tables.
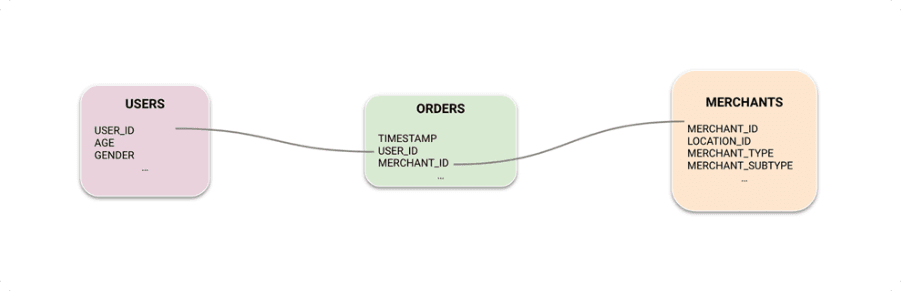
As expected, this model achieved a lower recall of 58.2% – only a 14.1% improvement over the legacy model.
This ablation study validates the hypothesis that the interactions table provides a meaningful signal, as well as our theoretical prior knowledge that deep learning models can always get better and better with more data. It’s also interesting to note that we’re still able to get an improvement over the legacy model even with just the minimum amount of data that is required!
Can we make context-aware recommendations?
In many cases, we want to make recommendations that are aware of context, such as the user’s location and how it changes over time. The Users table is indexed by a user_id column, so the client added a new table to the S3 directory containing one row with the following columns: TIMESTAMP (for point-in-time correctness), USER_ID (to link it back to the Users table), and LOCATION_ID (to match to the MERCHANTS.LOCATION_ID column). Note that we didn’t need to explicitly tell the model that it should match a user’s location to the merchant’s location, but the model is able to learn those relationships from the signal present in the data.
Running the same query on this new graph, the client was able to achieve a 68.8% recall – a 34.9% increase over the legacy model.
Getting our model ready for production
After running ablation studies and injecting context into the data, the client was ready to train a production model which was as simple as taking the best configuration so far (including the interactions and user location snapshot table) and editing the model plan to use the “Best” run mode which runs the maximum number of AutoML trials, as well as increasing the hidden dimensionality of the Graph Neural Network’s embeddings to 256, sampling up to 256 orders for each merchant and orders for each user when performing message passing. This model takes a bit longer to run, clocking in between 3 and 4 hours.
With this model the client was able to achieve a whopping 71.3% recall – a 40% improvement over the legacy model.
Business value in a matter of days
We’ve taken you through the journey our clients took to go from raw data to 40% improvement in a matter of days. Each experiment takes a matter of hours and the speed at which you can iterate is really only bounded by the number of hypotheses you want to test. In addition, there’s no longer a need to maintain the old legacy model which takes longer to train, is more expensive to serve, and is much more difficult to maintain.
Kumo’s predictions are also easy to integrate, with the ability to export Batch Predictions by REST API, which your system can then store in your data warehouse and serve to real traffic in production.