
Impact:
- Two production models built in less than 2 weeks for churn
- Additional 4 prototype models built for greenfield use-cases in only 7 days
- NPS Score of 10 from the customer data science team
Problem
In an effort to help reduce customer churn and retain revenue, this payment company had built a retention team and created retention programs. Their challenge was how to effectively leverage those programs for the right customers at the right time. Which customers needed extra attention or targeted incentives to stay active? They turned to KUMO to help solve this problem by predicting which customers would have the highest likelihood of leaving in the next sixty days. This would allow retention programs to be very effective at targeting the high risk customers in time to reduce
overall churn.
They wanted to encourage clients to buy items that they have purchased in the past as well as encourage them to buy new items that they have never purchased before.
Our client solved this recommendation problem by predicting which items would be purchased by each user for the future time period of interest. Kumo allowed them to easily frame and solve this problem as a Link Prediction task, predicting links between users and items in the bipartite graph.
Data Setup
The client’s our client shared their data through AWS S3 and wrote back the output of predictions into S3. The data shared was fifteen tables and 1 billion rows; a majority of which were raw transaction data. This was every transaction, of every point of sale device across their active customers. ser uploaded three tables to the Kumo platform.
Kumo Setup
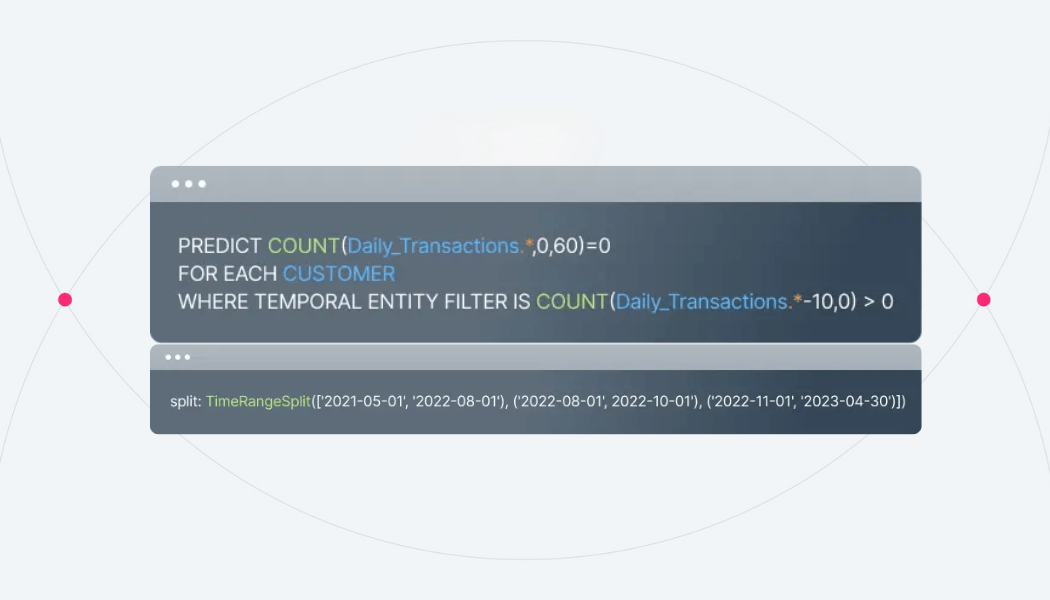
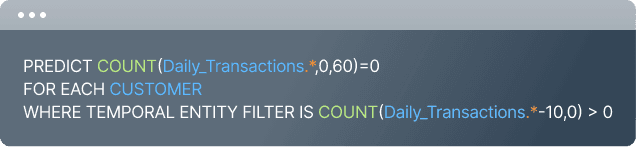
Below is one example of a predictive query used to model this churn use case. You can see that we specify the predictive target as simply a count on transactions table being equal to zero. If the count is equal to zero then this expression evaluates to True which serves as a positive label for a churned customer. We also define here the set of customers that are “active” who we want to score as part of this model. We use the temporal entity filter to achieve this. In this case we keep any customer who has had at least one transaction in the previous 10 days.
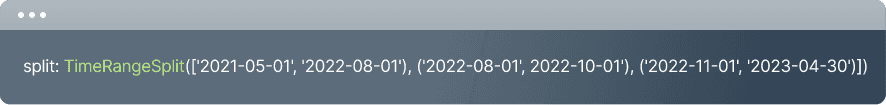
For this predictive query we wanted to have a five month hold-out set so that we could inspect predictions over time. Below are the advanced options used to create out-of-time validation and hold-out based on specific dates.
ADVANCED OPTIONS
Model Iteration
This customer gave KUMO access to over one billion data points spread across fifteen tables. Typically with this much data (over 200 Gbs) KUMO recommends starting with a subset of the graph to get a first model working. This allows for faster iteration, as well as informs the data scientist of the quality of the signal before going too deep. The modeling team only connected five of the fifteen tables initially, which were the ones they felt most critical to providing a signal to the churn problem.
The first model worked well out of the box, providing significant lift over random guessing. During this initial round of modeling they noticed that the transaction data was not aggregated. This means each individual transaction (thousands a day for every customer) was captured as a node in the graph. Given that the churn prediction problem was 60 days ahead, they realized that they could aggregate the transactions to a daily level; cutting down the volume of data in the final pipeline without losing signal. The KUMO team worked with the customer to get the new aggregated transaction data, as well as continued to add additional tables into the graph. The final “full graph” and formatted data provided a 20% accuracy boost on top of the small model they created initially.
Results
KUMO could accurately predict sixty day-ahead churn with a precision and recall of around 0.35 (based on maximum f1 threshold). This might seem low, but the churn rate was less than 1%. This means KUMO was 3000% better than random guessing which is a clear indicator of predictive signal.
One of the key metrics our customer was most interested in was the stability of the KUMO model performed across time. The customer modeling team set up a 5-month out of sample hold-out set that allowed them to answer this question. Below is an example of the results across 5-months. What they observed was that the recall metric was very stable across time. Precision was also generally stable, with the exception of January. The customer let us know this was an interesting finding. During January, many of the countries they operate in close down their stores and restaurants for multiple weeks for the holiday period. Their own internal predictive models always struggle to predict during January for this reason. This helped KUMO earn credibility that the results were realistic and could be trusted. Future iterations of the model can account for this seasonality by adding more years of data, and additional monthly features.
During the period where KUMO worked with this customer, they wanted to evaluate KUMO directly by getting hands-on time in the platform with their data.
KUMO spent time teaching the customers how to write the P-Query syntax, and then provided direct access to our platform. The customer not only built four completely new graph models in a week, but they were completely different predictive problems all coming from the same enterprise graph. For example one model was looking at predicting the rate of acquiring customers in different geographies, another was predicting the rate of prepaid card usage for a given customer, which they considered product upsell.
Overall the experience was very successful for the customer. Not only did KUMO help them solve a critical business problem in less than two weeks, but the platform’s low barrier to entry allowed them to keep building new use cases within a matter of days. As a result their data science team gave Kumo a net promoter score of 10, indicating that they would be highly likely to recommend
Kumo to a friend or colleague.
This proved the speed at which customers can get up and running with large scale machine learning, but also the flexibility of graph machine learning as the approach for solving a variety of enterprise problems.
Join our community on Discord.
Connect with developers and data professionals, share ideas, get support, and stay informed about product updates, events, and best practices.