

Written by Qun Wang, Assistant Professor at San Francisco State University
In this technical blog post, Qun Wang explains how he and his team members Binrong Zhu, Guiran Liu, Yang Liu, and Zhuwei Qin used KumoRFM to build their first-place project WildfireRFM at our KumoRFM August hackathon in San Francisco.
Qun’s article describes how they applied predictive queries on complex relational data and how KumoRFM enabled both long-term wildfire risk forecasting and real-time detection, forming the foundation of their three-layer AI architecture.
Our Approach with KumoRFM
Intro
Wildfires inflict devastating damage on communities and ecosystems, yet traditional monitoring methods like manual patrols are too slow to catch nascent threats before they escalate.
Our project, WildfireRFM, introduces an innovative three-layer AI architecture that combines long-term prediction with real-time validation to solve this problem.
Architecture Design
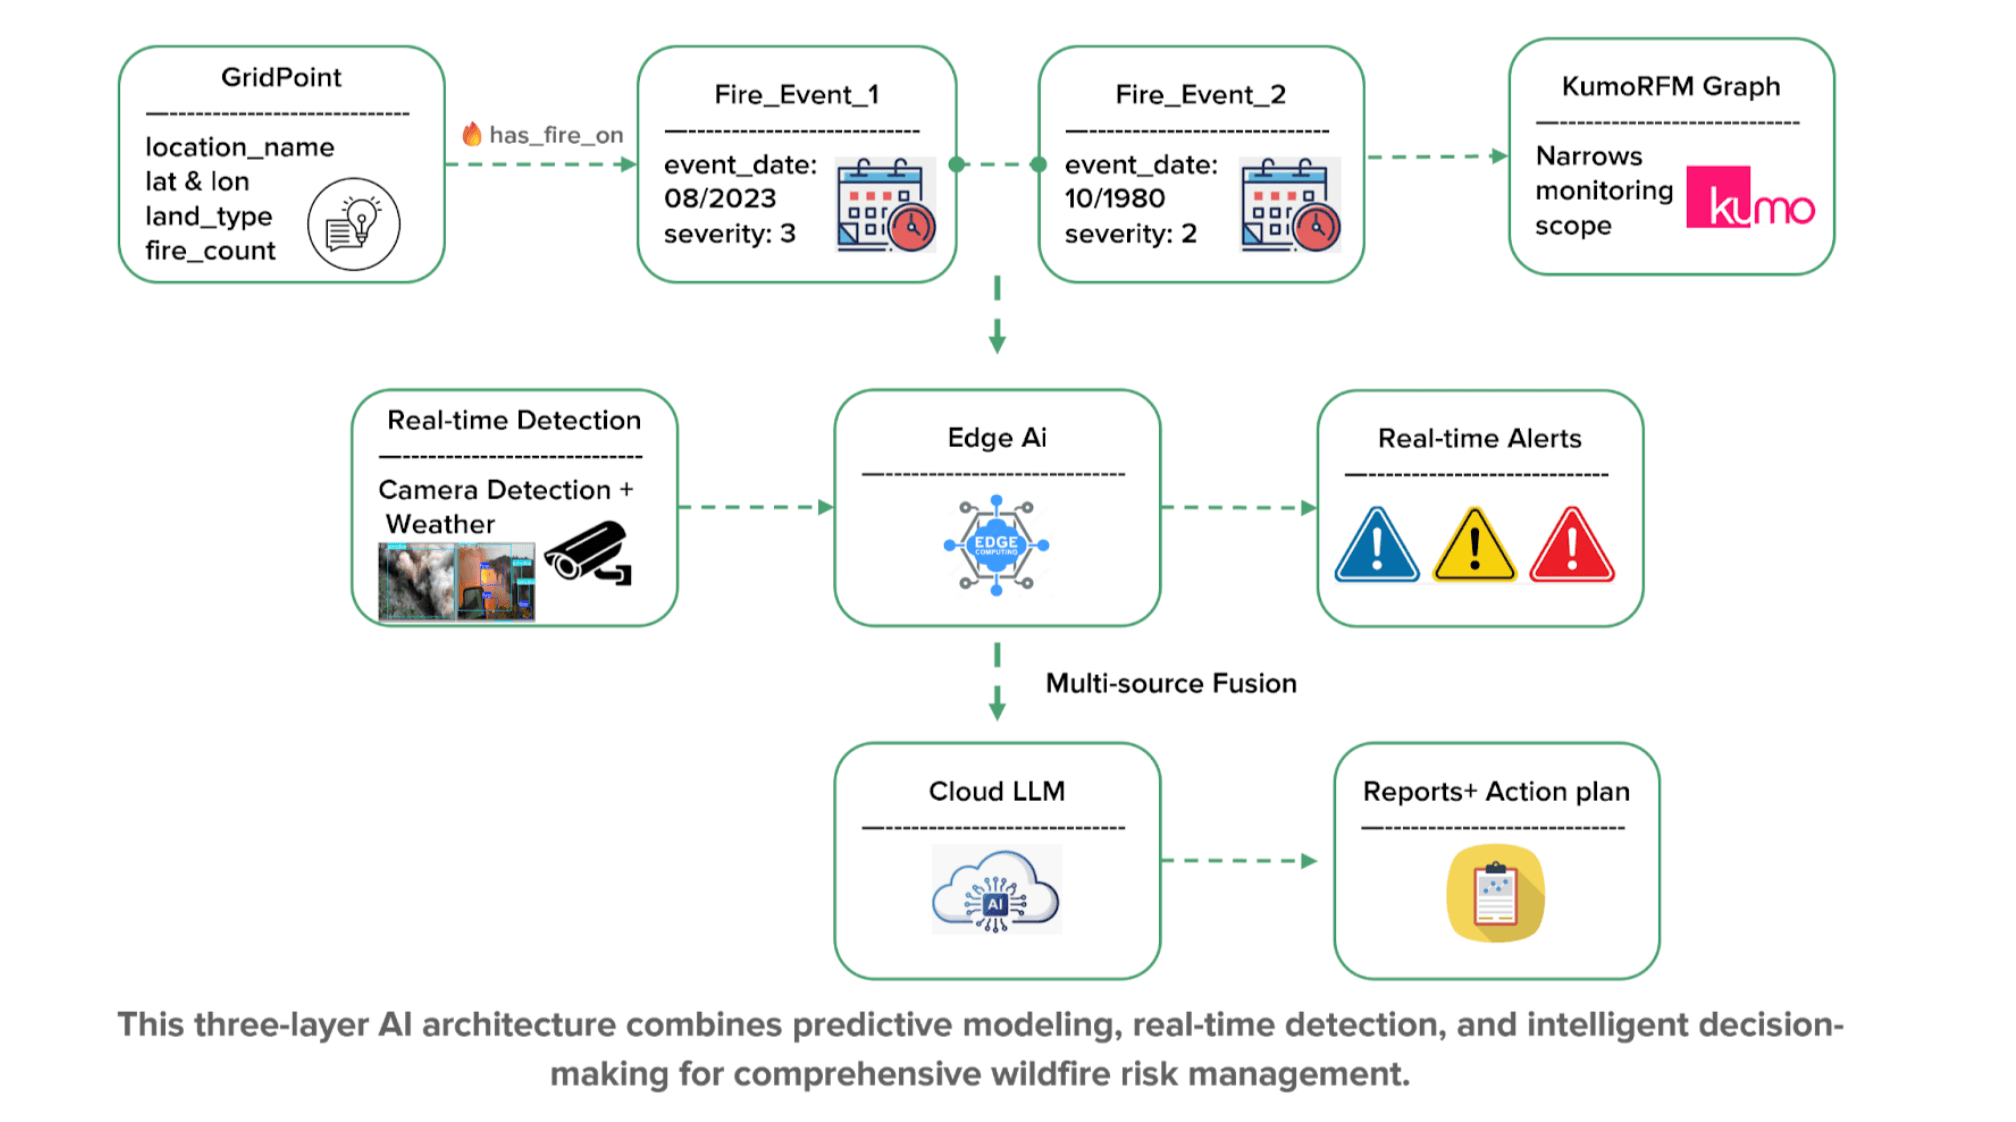
We use the KumoRFM foundation model to analyze complex relational data and predict the highest-risk wildfire zones, narrowing the monitoring scope. In these targeted areas, a network of Edge AI devices provides instant fire and smoke detection, which is then fused with other data by a Cloud LLM to generate automated, actionable emergency reports.
This architecture is built on a modular Python stack, with key components for data loading, the core LLM-based intelligent agent , and automated report generation.
Layer 1: Predictive Intelligence with KumoRFM
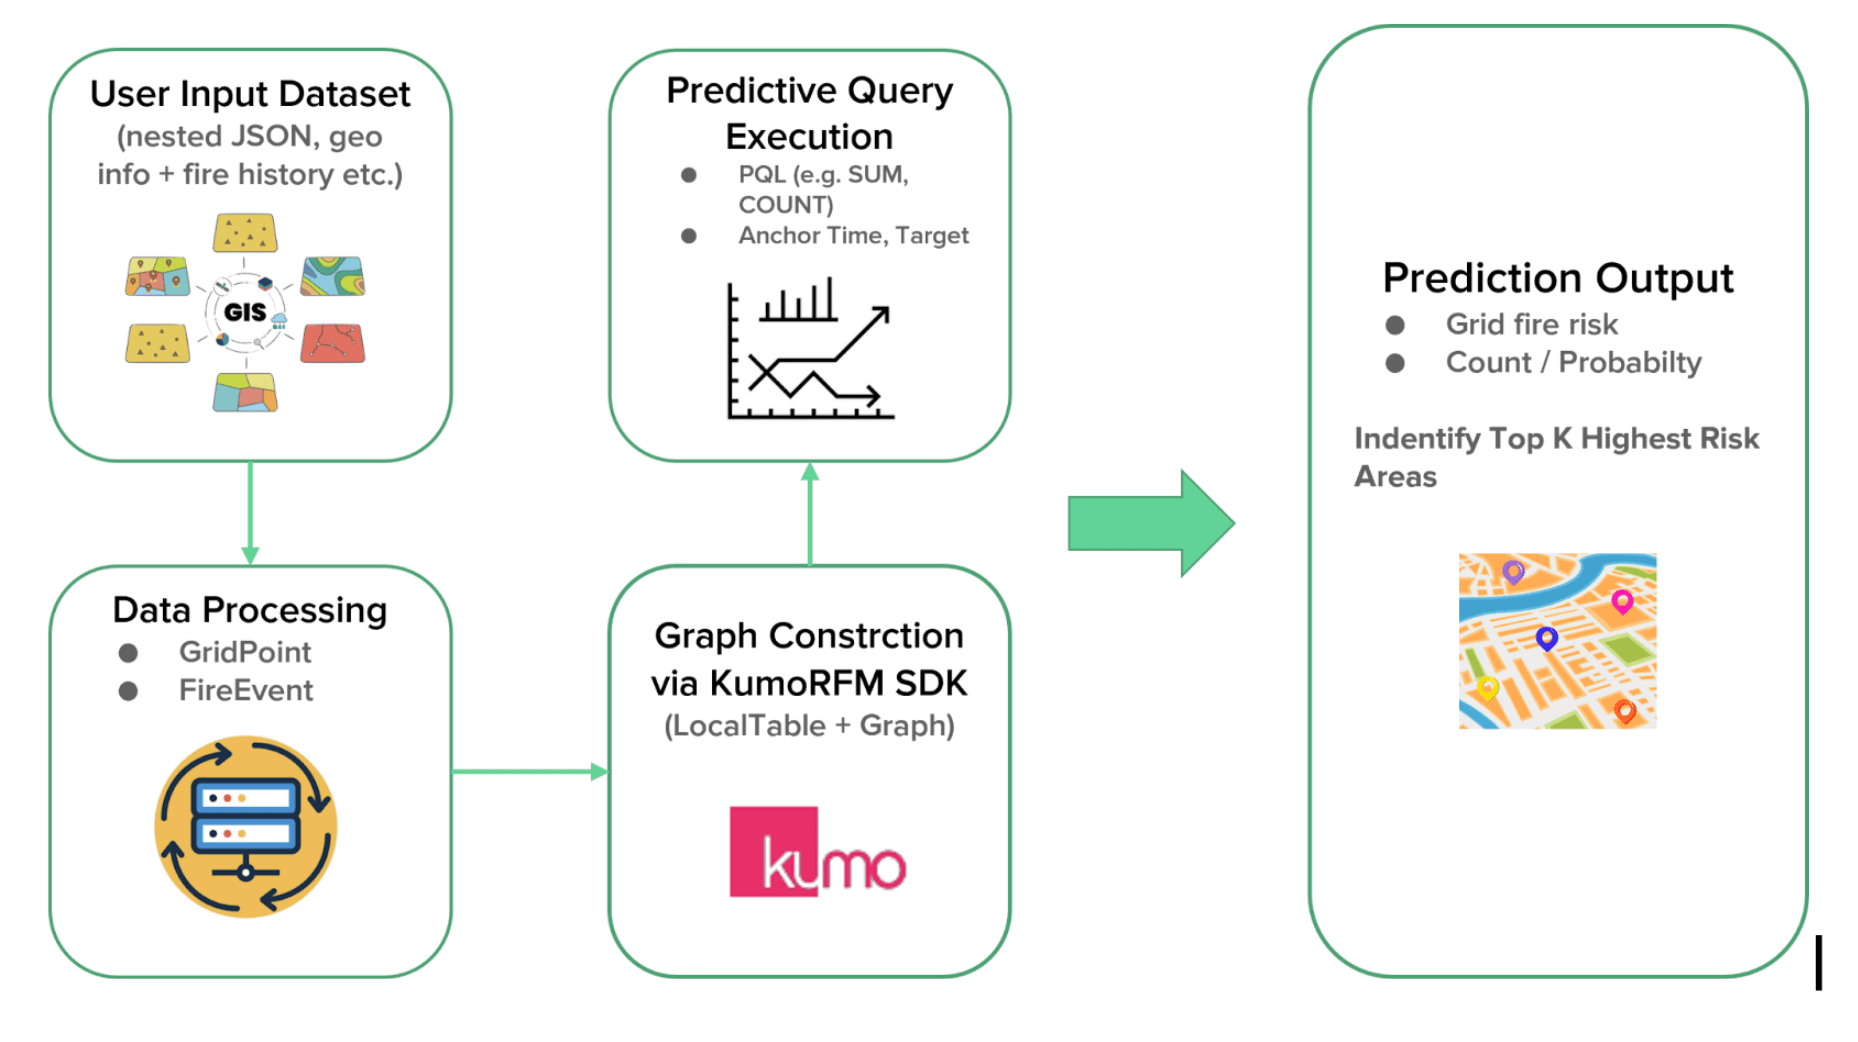
The first layer of our system focuses on long-term risk prediction, narrowing the monitoring scope from the entire state of California to a handful of high-risk zones. For this, we use KumoRFM, a foundation model specifically designed for predictive tasks on structured, relational data.
Our workflow is as follows:
- Data Modeling: We created a comprehensive dataset of over 26,000 grid points across California, with each point containing rich geographical and historical information in a nested JSONL format. We treat each geographical GridPoint as an entity (similar to "user" table) and each historical Fire_Event as fact (similar to an "order" table). The GridPoint table contains static features like latitude/longitude, county, land type, and historical fire count, while the Fire_Event table captures time-series events with dates and severity.
- Graph Construction: This data is processed into dataframes. The KumoRFM SDK then constructs a relational graph, automatically discovering the complex patterns between locations and their fire histories.
- Predictive Queries: We use Kumo's Predictive Query Language (PQL) to ask forward-looking questions, such as "What is the predicted count of fire events for each grid point in the next 30 days?".
- Prediction Output: The model outputs a risk score or probability for each grid point, allowing us to identify the Top K highest-risk areas for any given time window. This approach is far more transparent and interpretable than traditional "black-box" regressors.
Layer 2: Real-time Intelligence with Edge AI
Once KumoRFM identifies the highest-risk areas, we deploy our second layer: a network of edge devices for immediate threat detection. This addresses the challenge of capturing in-progress events that long-term models would miss.
- Technology Stack: This layer runs on power-efficient hardware like the NVIDIA Jetson. On these devices, we deploy a fine-tuned YOLOv8 computer vision model for real-time fire and smoke detection from camera feeds, alongside a quantized LLaMA3.1 large language model for on-site data analysis.
- Real-time Data Fusion: The edge devices integrate visual detections with live meteorological data (temperature, humidity, wind speed) from the OpenWeatherMap API.
- Instant Alerts: If a fire or smoke is detected, the edge device generates an immediate alert, providing an instant, on-the-ground validation of the predicted risk. This ensures we don't miss critical response time windows.
Layer 3: Decision Intelligence with Cloud LLM
The final layer acts as the central brain, performing multi-source fusion to generate a holistic and actionable intelligence report.
- Comprehensive Analysis: This layer receives data from the first two: the long-term risk score from KumoRFM and any real-time alerts from the Edge AI network. A powerful cloud-based LLM, gpt-4o-mini, synthesizes this information with geospatial data, historical incident frequency, and the proximity of emergency resources.
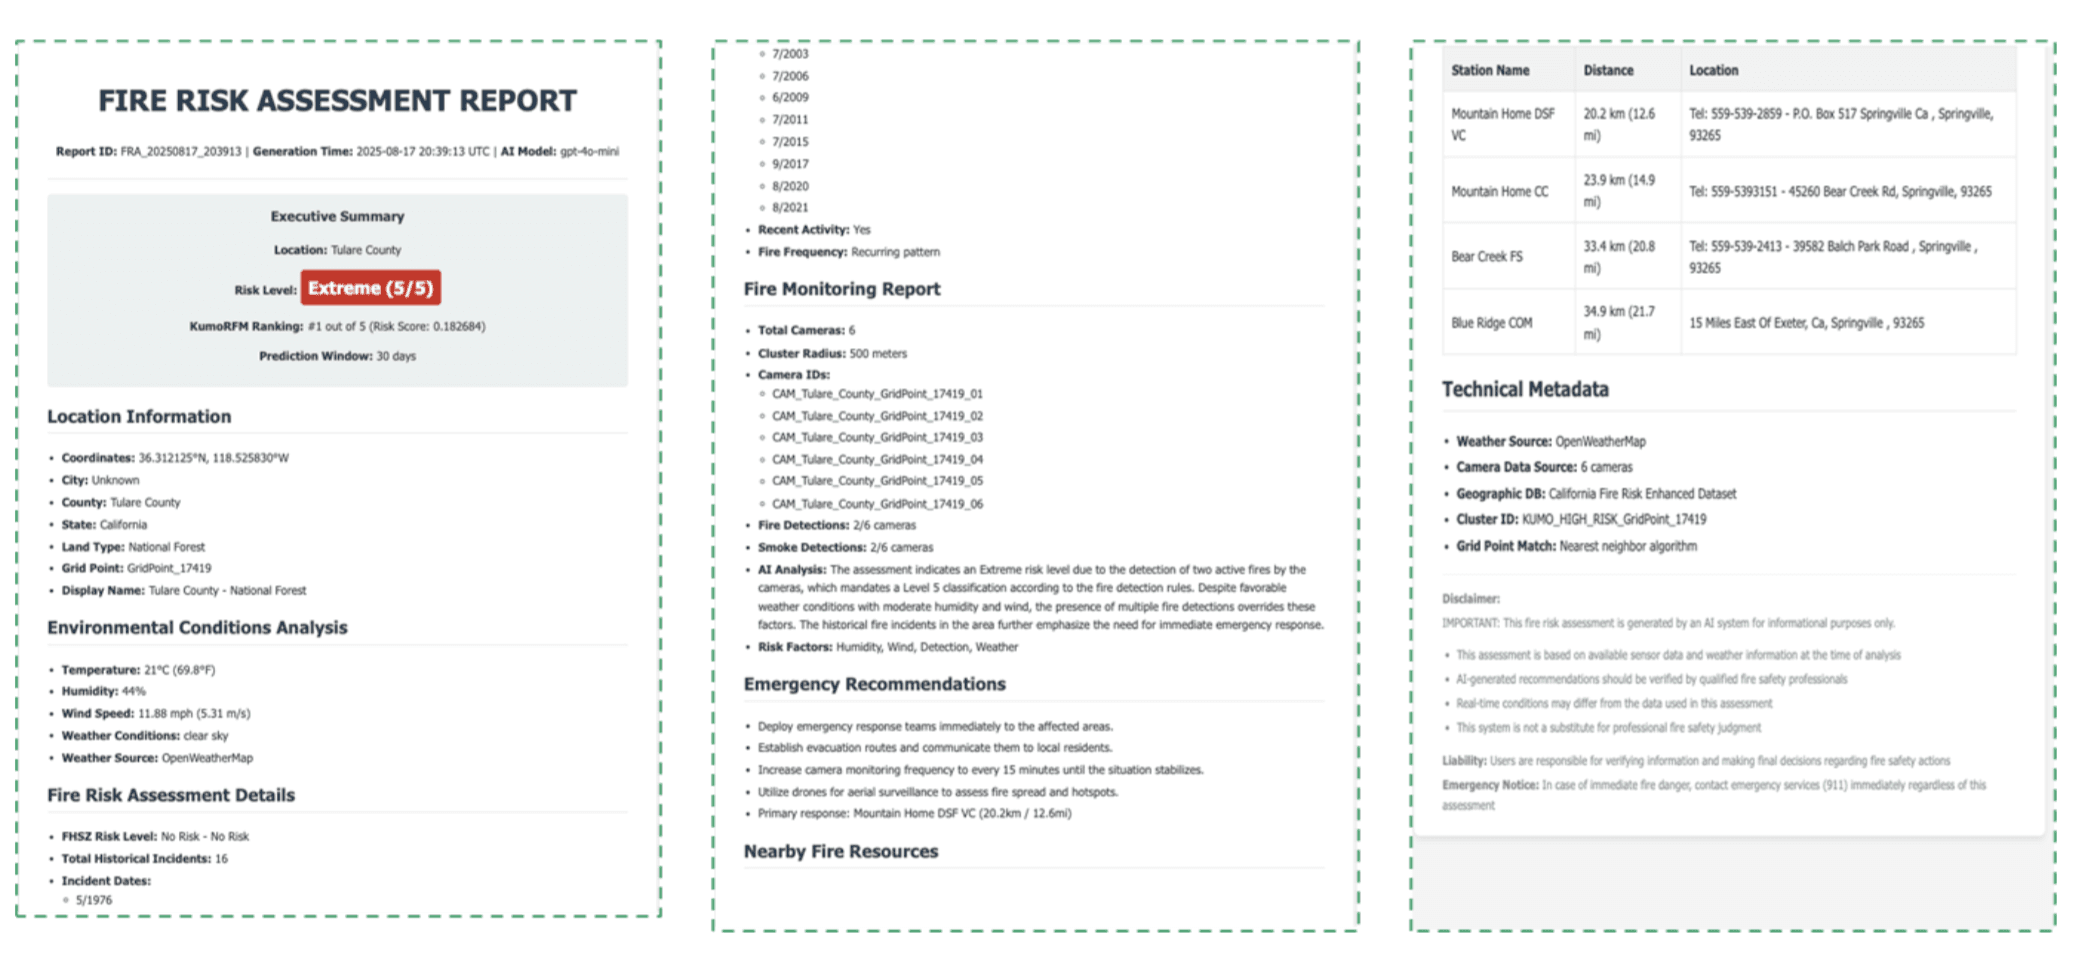
- Automated Report Generation: The system automatically generates a professional Fire Risk Assessment Report in both HTML and JSON formats. As seen in our case studies, this report includes:
- An Executive Summary with a clear, color-coded risk level (e.g., Extreme 5/5).
- Detailed environmental conditions and camera detection status.
- An AI Analysis section that explains the reasoning for the risk assessment in plain language.
- Actionable Emergency Recommendations, such as deploying response teams or increasing monitoring frequency.
- A list of Nearby Fire Resources with distances and contact information.
This three-layer approach creates a complete feedback loop, using long-term prediction to guide real-time observation, and fusing both into automated, intelligent reports that empower decisive action.
Experiments & Results
To validate our system, we conducted a series of experiments focusing on each layer of the architecture, from the underlying datasets and model training to a comparative analysis of different LLMs for risk assessment accuracy.
Datasets Used
Our primary dataset consisted of over 26,000 grid points across California, structured in a JSONL format. This dataset served as the foundation for the KumoRFM predictive model. Each grid point, or "user," contained rich, multi-faceted attributes crucial for risk assessment:
- Location Data: Including latitude, longitude, and county.
- Land Information: Such as land type (e.g., National Forest, Private Land) and ownership.
- Fire Risk History: Including the total count of historical fires, specific incident dates, and the official Fire Hazard Severity Zone (FHSZ) level.
- Emergency Resources: Information on the number of nearby fire stations and their locations.
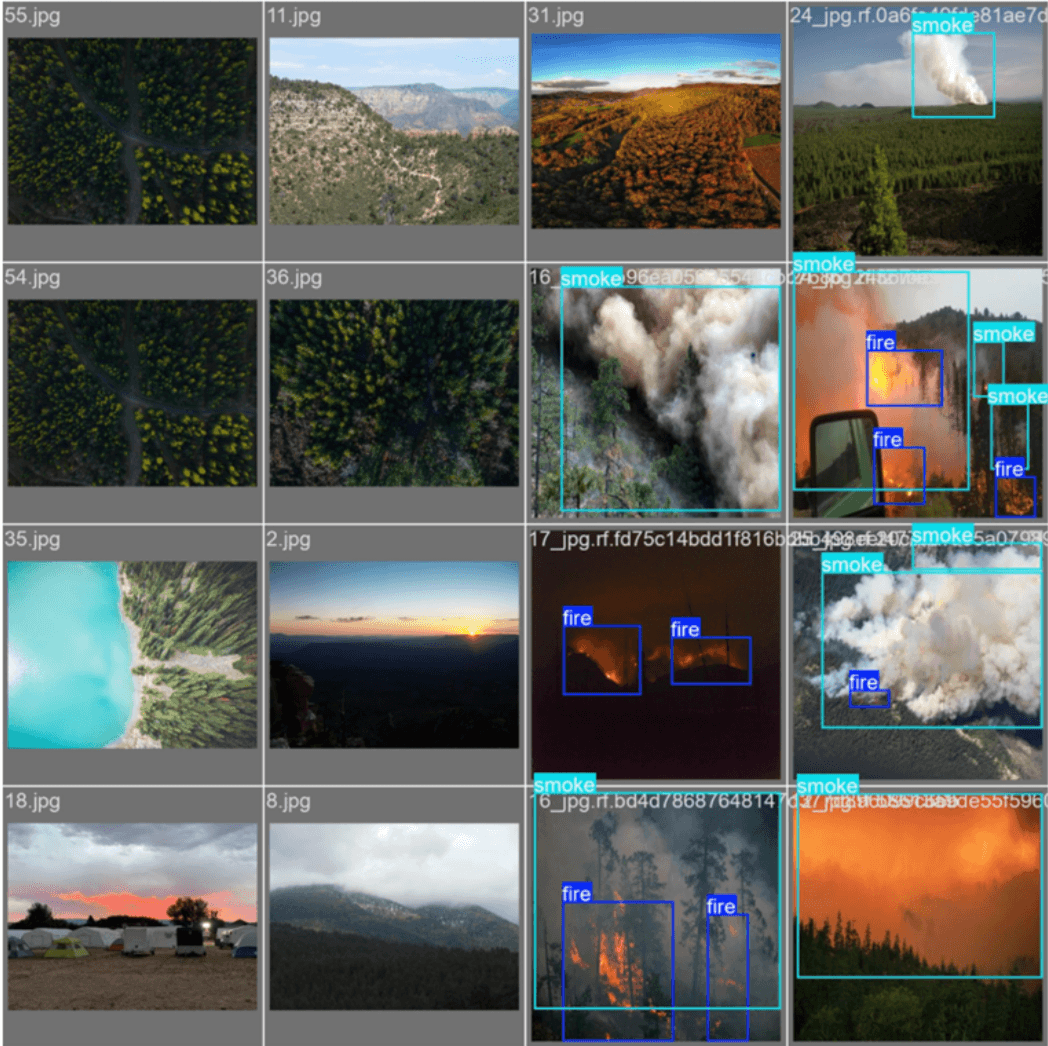
For the Edge AI layer, we prepared a custom image dataset for training the YOLOv8 object detection model. The images were organized into three main categories: fire, no fire, and smoke. We used Roboflow to annotate this data with two target classes—'fire' and 'smoke'—and split the collection into standardized train, validation, and test sets.
Setup and Configuration
Our experimental setup was tailored to the specific requirements of each AI layer.
- Edge AI Model Training: The YOLOv8 model was trained for 100 epochs on our custom dataset. Initial training was performed on Google Colab, with subsequent training and validation conducted on a more powerful HPC to leverage greater computational resources. The deployment hardware for the edge component was an NVIDIA Jetson Nano running a custom environment to handle complex version dependencies between Python, PyTorch, and CUDA.
- LLM Inference Engine: The decision intelligence layer was tested on a MacBook Pro with an M2 Pro chip. The primary model, LLaMA3.1-8B, was deployed locally using the Ollama framework and was quantized to reduce its memory footprint and computational load, making it suitable for edge or near-edge environments.
Key Results
Our experiments yielded strong results, validating the accuracy and efficiency of our multi-layer design.
1. YOLOv8 Fire and Smoke Detection
The YOLOv8 model demonstrated its ability to successfully identify and draw bounding boxes around fire and smoke in test images, confirming its viability for real-time detection on the edge. The metrics for precision and recall also showed steady improvement throughout the training process.
2. LLM Risk Assessment Accuracy
We conducted a comparative study to evaluate the reasoning capabilities of various LLMs in assigning a wildfire risk score on a scale of 1-5. We tested in both single-camera and multi-camera scenarios, with ground truth scores established by expert annotation. Across both settings, the model achieved the most balanced and accurate performance. It correctly identified high-hazard forest zones while showing greater consistency and fewer false positives in ambiguous urban settings.
Join our community on Discord.
Connect with developers and data professionals, share ideas, get support, and stay informed about product updates, events, and best practices.