> ## Documentation Index
> Fetch the complete documentation index at: https://kumo.ai/docs/llms.txt
> Use this file to discover all available pages before exploring further.
# How do I improve model performance?
Accurate predictions require both fitting a good model and supplying quality data. While Kumo takes care of the model quality aspect, you can do some things on the data side to improve the model's performance.
## Good Data Quality
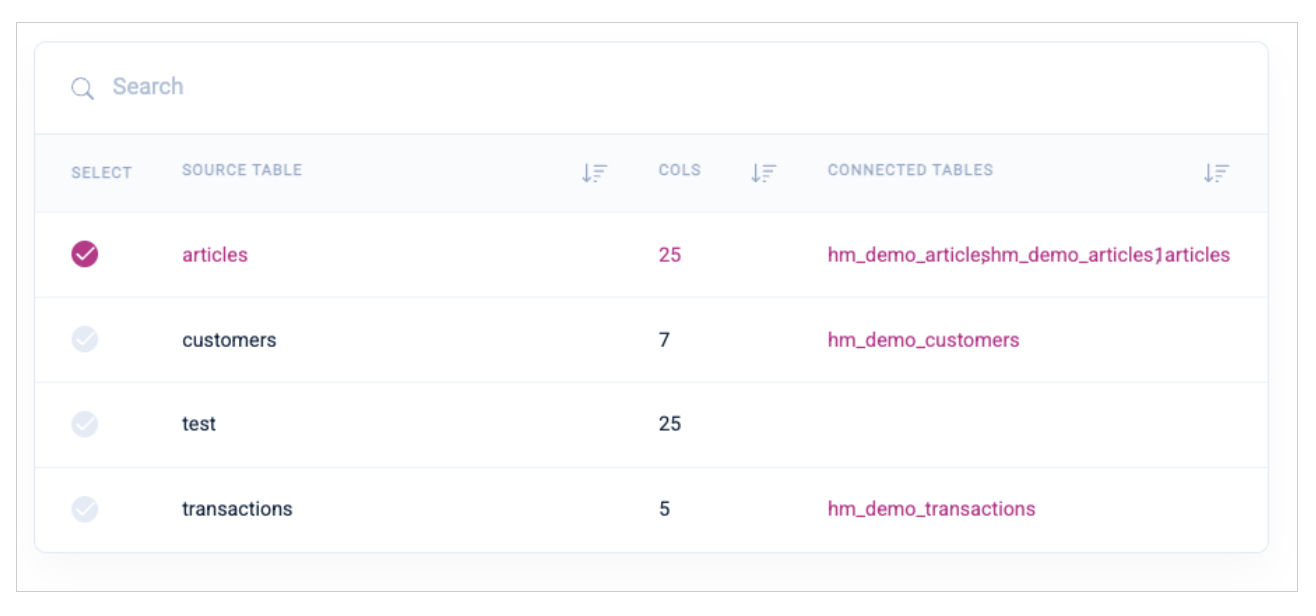
A good predictive model starts with selecting informative features that are preprocessed in a sensible and reproducible manner. To this end, Kumo allows you to select which table columns to include in your prediction tasks.
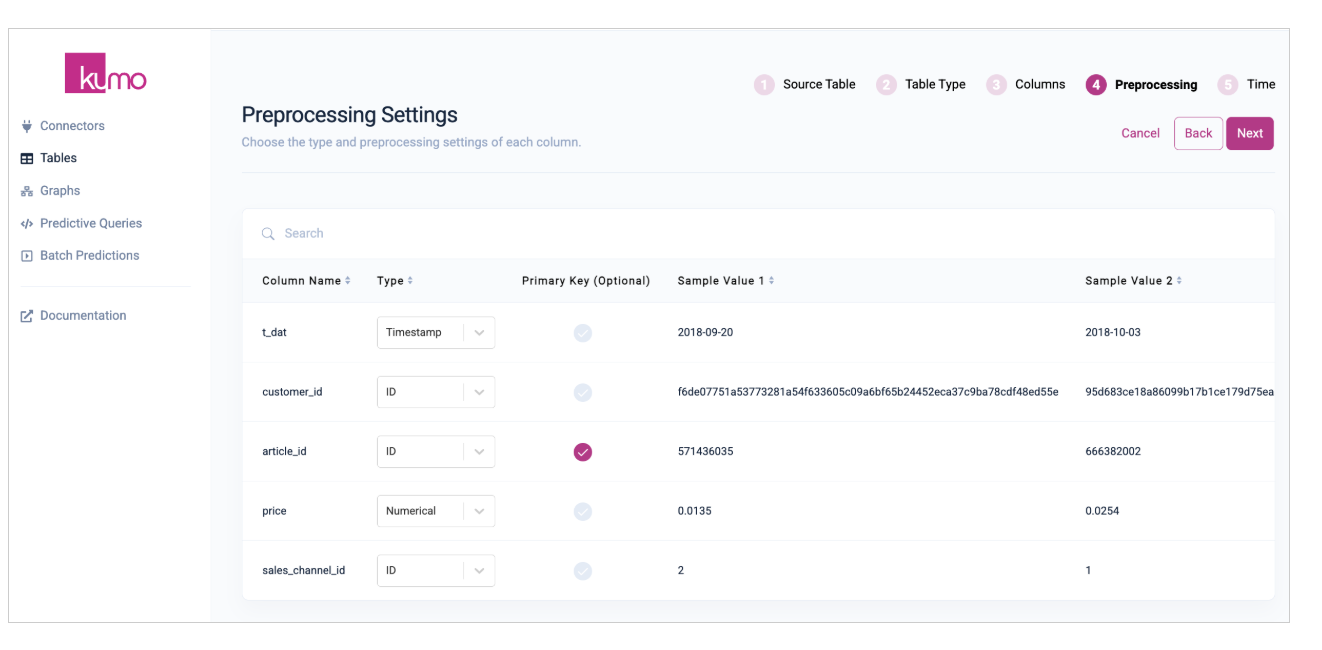
 Kumo also allows you to select the type and preprocessing settings for each column—you can also accept the provided default values.
 After creating a Kumo table, you can analyze its column statistics to verify that it contains the expected data.
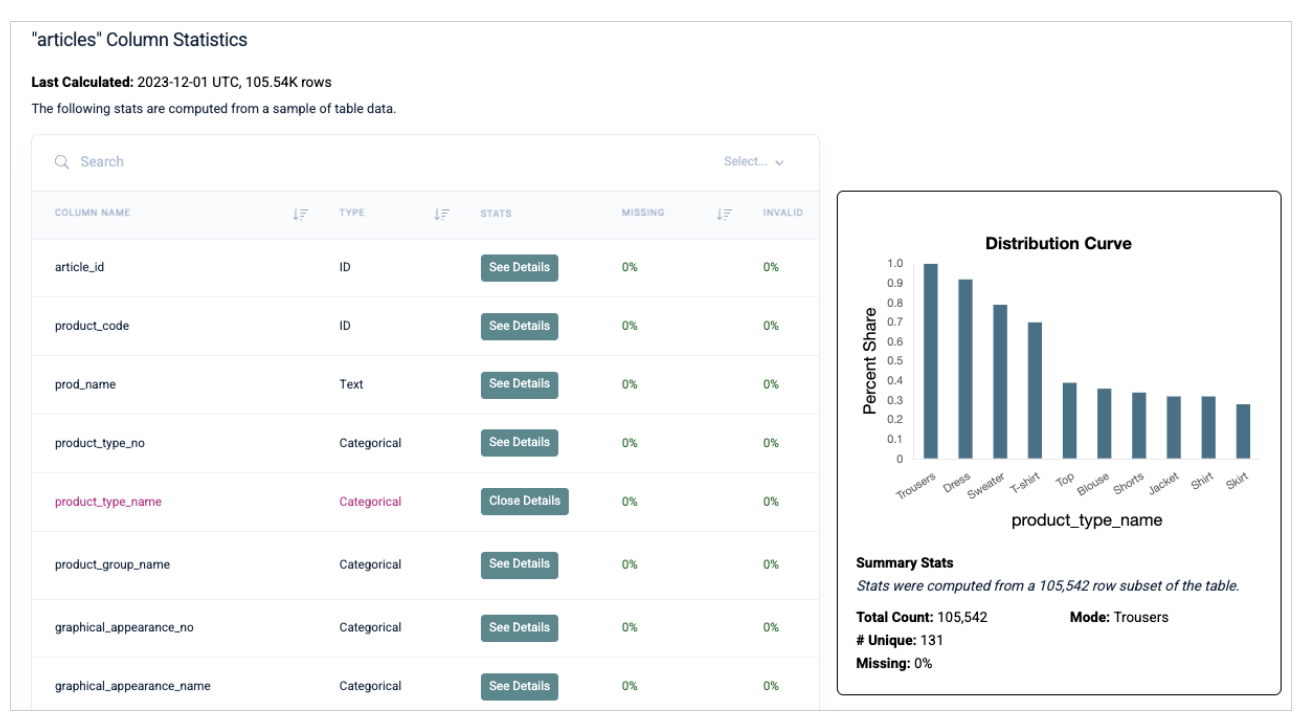 Click on `See Details` to view more statistics and granular information about the column.
***
## Ensure Good Table Connectivity
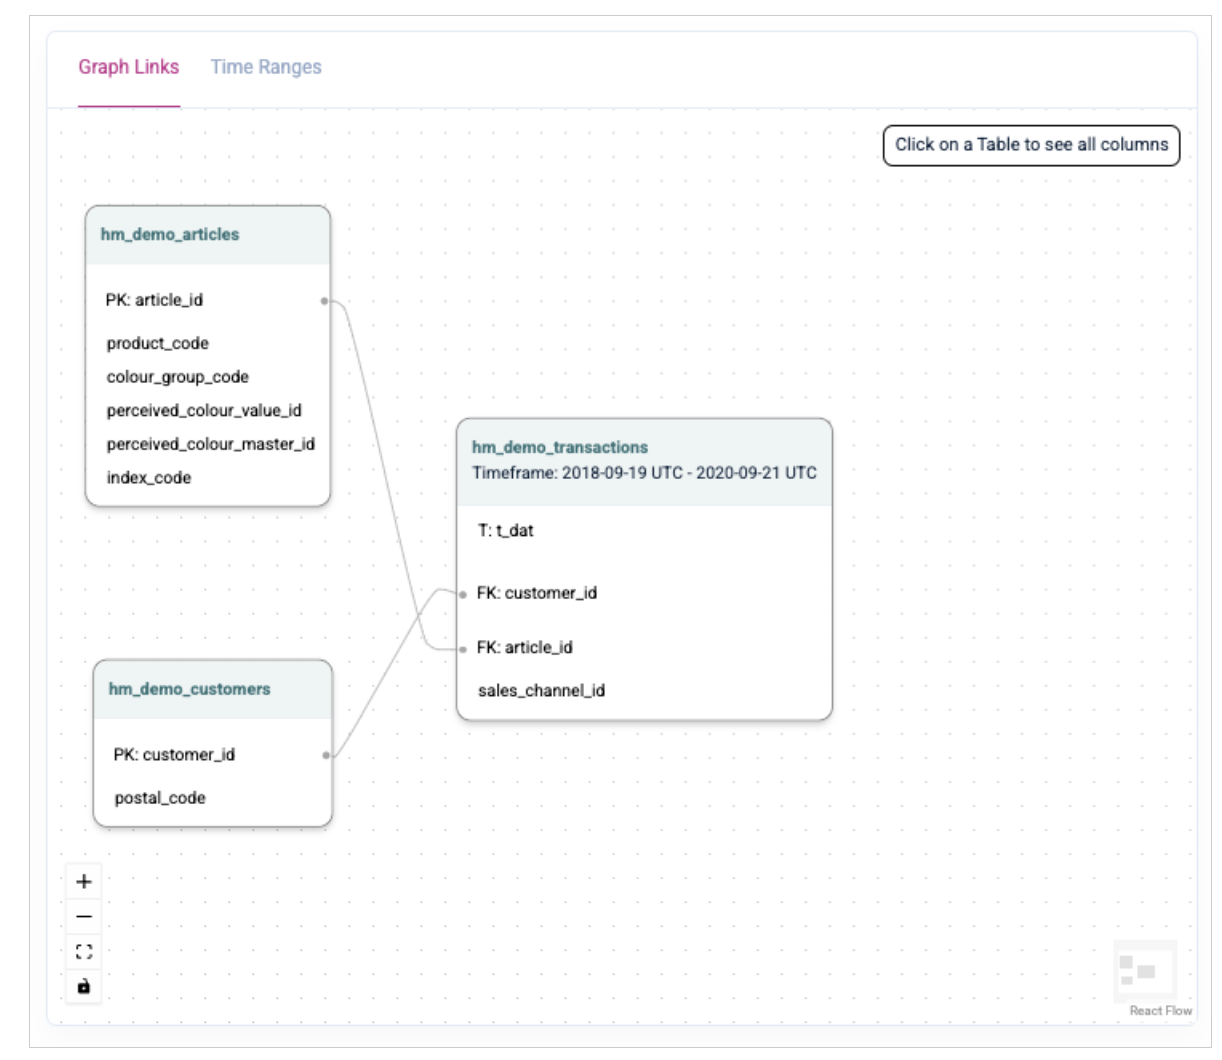
If multiple tables are included in the graph creation process, linkages must be established between tables to make a single connected graph. Two tables can be connected if they share a column with the same underlying data. For example, you might have a fact table recording customer transaction history, and another dimension table containing customer profile information, with both tables containing a customer ID column. These two tables can be connected via the customer ID column.
Click on `See Details` to view more statistics and granular information about the column.
***
## Ensure Good Table Connectivity
If multiple tables are included in the graph creation process, linkages must be established between tables to make a single connected graph. Two tables can be connected if they share a column with the same underlying data. For example, you might have a fact table recording customer transaction history, and another dimension table containing customer profile information, with both tables containing a customer ID column. These two tables can be connected via the customer ID column.
 ### Assessing Graph Linkage Health
After connecting all the tables in a graph, Kumo provides insights into your graph's connectivity.
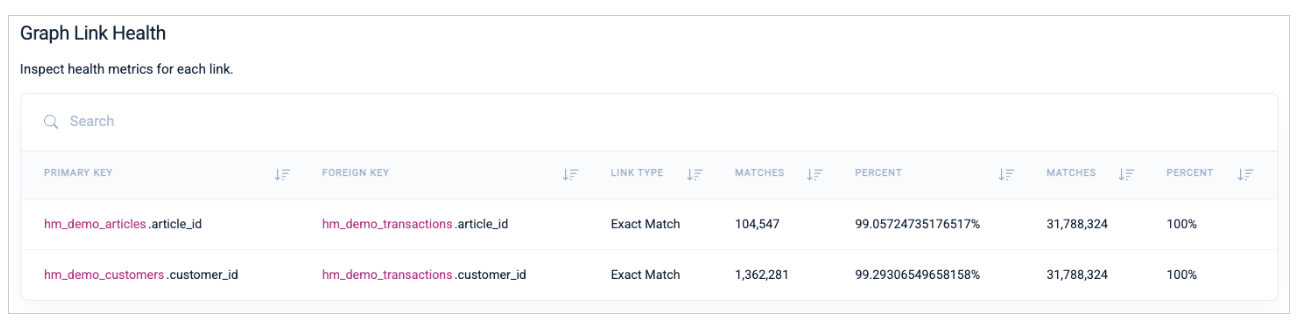
If you view the `Graph Link Health` table at the bottom of the page, you can see the percentage matching between each pair of linked tables. Lower-than-expected percentages may be symptoms of poor data quality or incorrect column pairings.
### Assessing Graph Linkage Health
After connecting all the tables in a graph, Kumo provides insights into your graph's connectivity.
If you view the `Graph Link Health` table at the bottom of the page, you can see the percentage matching between each pair of linked tables. Lower-than-expected percentages may be symptoms of poor data quality or incorrect column pairings.
 If you discover data quality issues after creating your graph, you can easily fix the data issues in your underlying data table and re-upload your data to Kumo. The next time you train your predictive query on your graph, Kumo will automatically re-ingest the table and connect the graph using the same connections, but updated values.